 Download slides
Truckload rate pressure builds heading into the holidays
Published: Donnerstag, November 05, 2026 | 09:00 CDT
Onthispage
Truckload market has tightened unevenly
Several regional disruptions have created pockets of tighter truckload capacity and higher rates in the United States, deviating from standard seasonality over the past month.
The end-of-quarter shipping push in the final week of September was stronger than recent years, tightening capacity into October. The Pacific Northwest and Upper Midwest were among the tightest markets, with load-to-truck ratios (LTRs) reaching their highest levels of the year.
Conditions have since diverged:
- Upper Midwest pricing has largely leveled off.
- In the Pacific Northwest, added demand for seasonal harvests is keeping capacity tight and rates elevated. Historically, outbound Pacific Northwest rates rise in the fourth quarter, and current conditions suggest that could persist through year-end.
- The Gulf Coast also experienced brief tightening in October as shippers and carriers prepared for tropical storms. The impact was modest and short-lived, reinforcing how quickly localized events can affect a market when there’s less excess trucking supply to absorb a disruption.
California and the Southwest emerge as the largest outlier
This region has experienced the most notable deviation from typical seasonal patterns. Capacity tightened sharply at the end of the third quarter and remained constrained through October, with rates increasing faster than normal for this time of year.
Several factors have contributed. Elevated containerized imports into Southern California, including imports from China associated with pre-Golden Week loadings and holiday retail inventory, increased drayage and inland moves.
Typhoons that closed some of China’s largest ports also disrupted ocean shipping schedules, contributing to vessel bunching and uneven import flows into Southern California. Rather than ocean freight arriving at the ports steadily across several weeks, concentrated arrivals have created short bursts of truckload demand that further tighten the market.
Other factors such as flooding and Mexico border strikes exacerbated the situation.
Near-term outlook
Higher-than-expected rates entering October have slightly increased expectations for truckload pricing through the remainder of 2026. Higher year-end rates are then expected to lift the forecast curve for 2027, although the underlying shape of the forecast remains unchanged.
Typically, early November provides a period of relative rate relief before Thanksgiving and the year-end trucking surge. This year, that relief may be more limited. Truckload supply remains constrained, and recent conditions continue to demonstrate that relatively small or localized disruptions can produce larger and longer-lasting effects than they would in a market with excess capacity.
Nationwide, conditions are expected to remain relatively stable during the first half of November before tightening around Thanksgiving. Capacity pressure and rates are then expected to increase into December as holiday shipping, reduced driver availability, and year-end freight compete for a smaller pool of available trucks.
Potential labor disruption at the ports of Los Angeles and Long Beach is another development to monitor. Although the workers involved represent a relatively small portion of the overall port workforce, any picket activity that affects broader terminal or truck access could create additional freight disruption. At this stage, this remains a risk to monitor rather than an assumed market impact.
The broader takeaway heading into year-end is that seasonality is still influencing the truckload market, but reduced capacity is amplifying the impact of regional events and demand surges.
Fuel impact
As detailed in the Diesel Fuel section of this report, diesel prices have been rising faster than the price of the crude oil from which it’s made. For U.S. freight transportation, the immediate concern is pricing and distribution dynamics.
Although widespread diesel shortages have not emerged, high prices and isolated supply issues are affecting carriers and shippers alike. For truckload carriers, approximately 16% of all miles driven are non-revenue-generating miles, which means that higher diesel prices affect the rates carriers charge in order to recoup those expenses.
Refrigerated carriers have additional stress because their trailers consume fuel to maintain proper temperatures. Flatbed also tends to burn more fuel than a typical shipment, due to the freight being heavier or less aerodynamic, higher deadhead and out-of-route mileage, as well as the loss of highway fuel efficiencies for more rural job-site deliveries.
Elevated fuel costs affect some carriers’ profitability to the point they leave the market. This creates a dual challenge for shippers: Not only do they have to pay higher fuel surcharges, but they must also deal with a smaller carrier pool.
In some western U.S. markets, fuel costs have risen enough that shippers are moving away from national fuel tables to determine fuel surcharges and using regional fuel-surcharge structures instead. As a result, lower seasonal demand in a region does not necessarily translate into equivalent rate relief.
U.S. spot market
U.S. spot market forecast: Dry van truckload
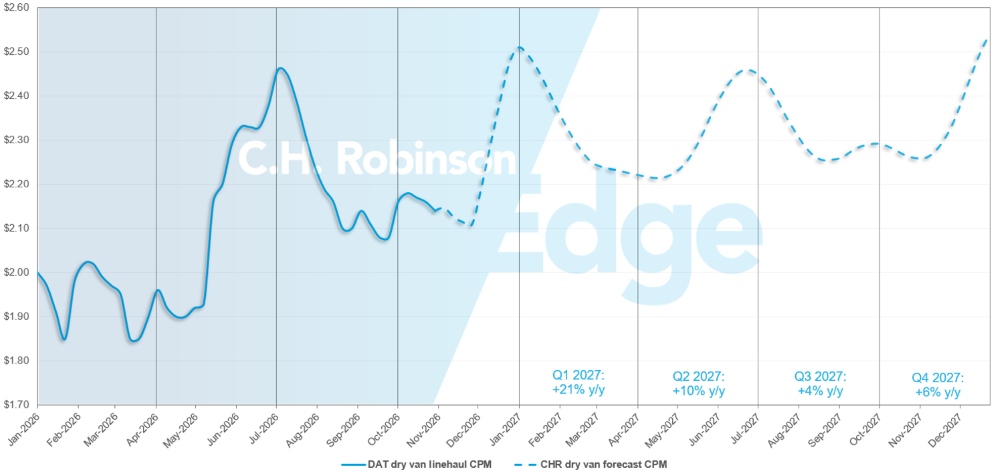
The C.H. Robinson 2026 dry van cost-per-mile forecast is increasing from +30% year over year (y/y) to +31%, while the 2027 forecast remains at+10% y/y.
C.H. Robinson spot market dry van truckload forecast
U.S. spot-market forecast: Refrigerated truckload
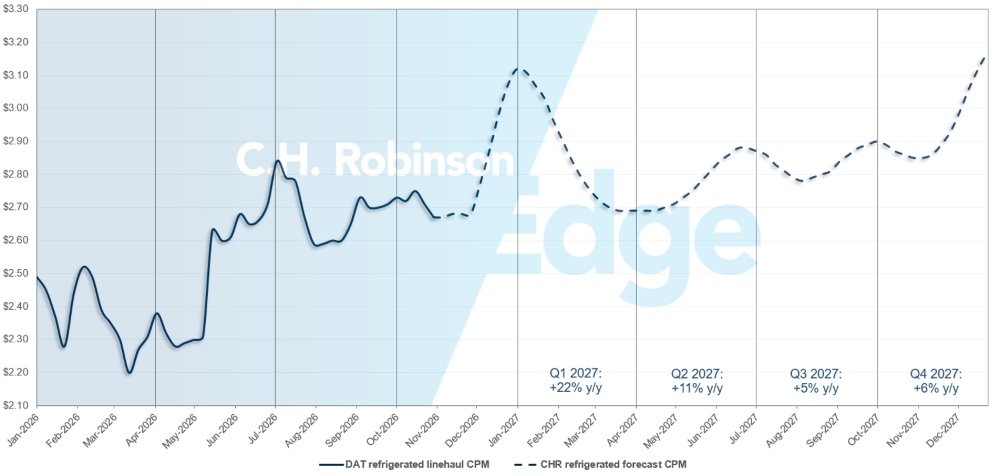
The C.H. Robinson 2026 refrigerated van cost-per-mile forecast is increasing from +31% y/y to +32%, while the 2027 forecast remains at +11% y/y.
C.H. Robinson spot-market refrigerated truckload forecast
U.S. spot-market forecast: Flatbed truckload
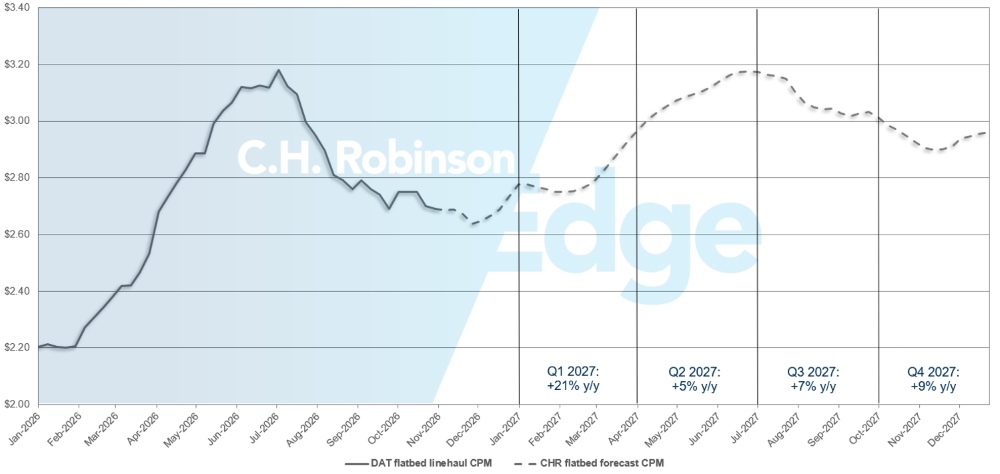
The C.H. Robinson 2026 flatbed cost-per-mile forecast remains at +28% y/y, while the 2027 forecast remains at +10% y/y.
C.H. Robinson spot-market flatbed truckload forecast
Contract truckload environment
The following insights are derived from C.H. Robinson Managed Solutions™, which serves a large portfolio of customers across diverse industries.
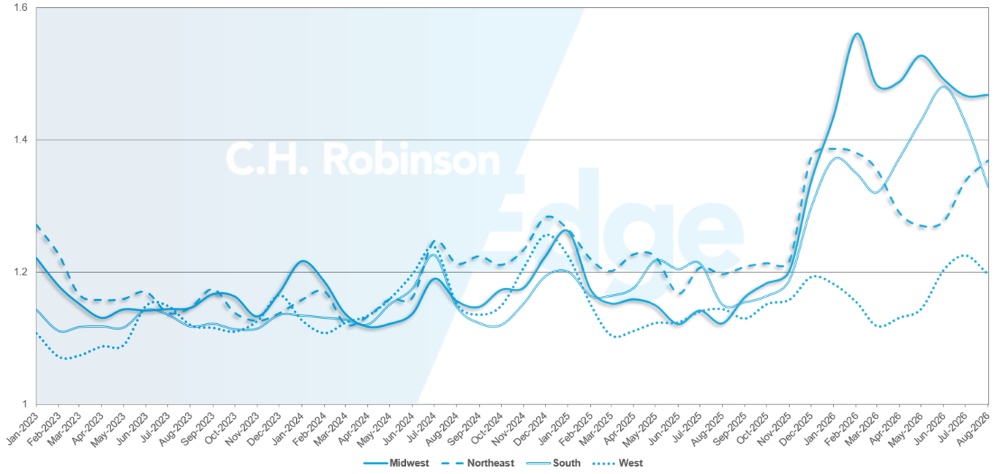
Route-guide depth is an indicator of how far a shipper needs to go into their backup strategies when awarded transportation providers reject a tender. Route-guide depth of 1.0 would be perfect performance, and 2.0 would be extremely poor.
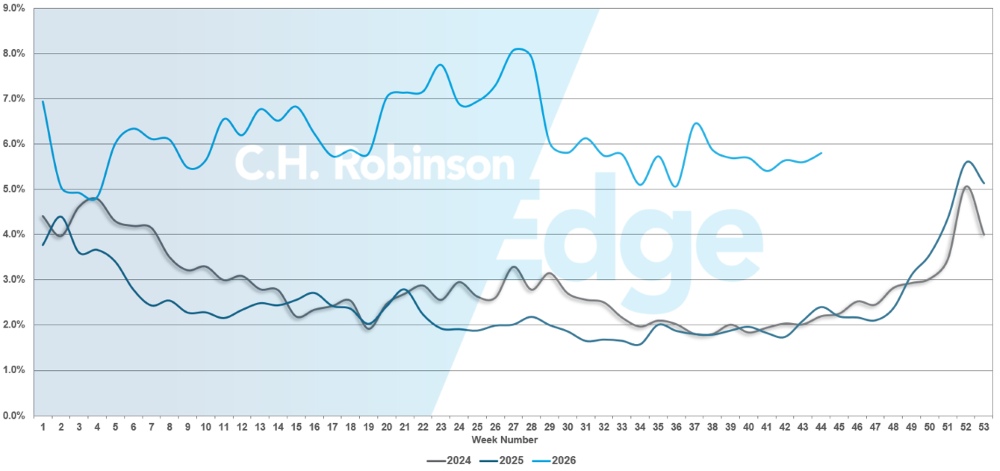
Route-guide failure is when the route guide has been exhausted with no carrier accepting the tender, sending the shipment into the spot market.
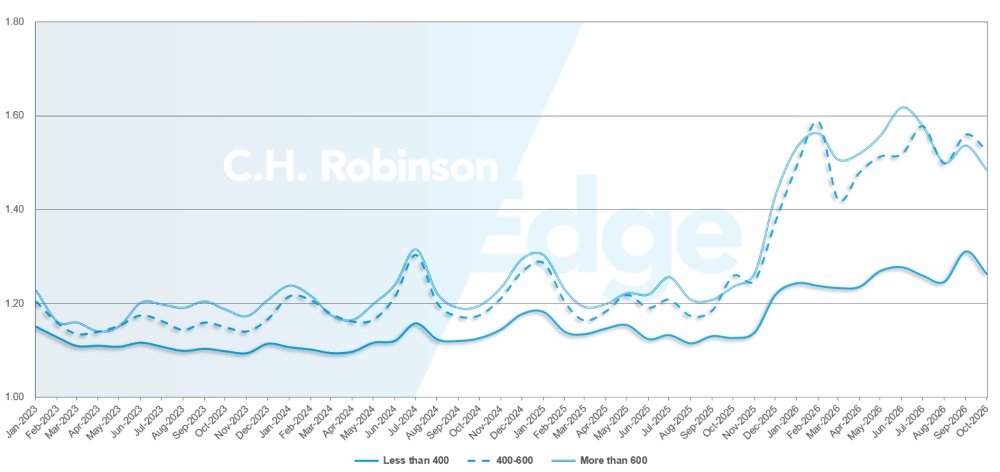
As displayed in the following chart, route-guide depth had remained flat at a historically low level for approximately two years. Beginning in late November 2025, the first signs of a changing market showed up as route-guide depth surpassed 1.3 for the first time in years and failures increased to ~5%. Since then, route guides have faced a backdrop of decreasing capacity.
For the month of October, route-guide depth across all North America shipments was 1.36, slightly better compared to the previous month.
From a mileage perspective, long hauls of more than 600 miles had a route-guide depth of 1.49 in October, which is better compared to the prior month of September 2026 at 1.54, and worse compared to October 2025, which was at 1.24.
For shorter hauls of less than 400 miles, the route-guide depth for October 2026 was 1.26, which is better than the previous month of 1.31 but worse than October 2025 at 1.13.
This indicates that route guide performance has stabilized rather than continuing to erode. However, recent holidays have produced clear spikes in failure rates, suggesting the same could happen for Thanksgiving and year-end shipping despite otherwise steady conditions.
North America route-guide depth: By length of haul
Geographically, the West experienced the smallest change of all regions but was the only region which didn’t improve in performance in October, worsening by 1% from the previous month. The Midwest experienced the largest change, improving by 7.6%. Route-guide depth varies widely depending on region, between 1.22 and 1.52.
U.S. route guide depth metrics: By region
U.S. route guide failures
Refrigerated truckload
East Coast United States
Conditions for refrigerated freight across the East Coast remain divided between the Northeast and Southeast.
In the Southeast, the market has been relatively stable for the past several months, with capacity and demand settling into a more balanced state. That pattern is expected to continue through November, outside of short-lived capacity tightening around Thanksgiving and other holiday-related food demand.
The Northeast is following a different path. Capacity has recently improved, but spot rates have remained elevated and continued to move higher despite the additional truck availability. That disconnect suggests that carrier operating costs, particularly fuel, are influencing pricing even as the underlying supply-demand balance improves.
Looking ahead, rates are expected to begin leveling off in November, although winter weather could push rates up again as the month progresses and carriers become more selective about operating in affected markets.
Central United States
Refrigerated capacity across the central United States improved modestly during October, while rates remained relatively steady. The slower response in pricing reflects broader market pressures, including elevated fuel and operating costs, which continue to limit how quickly an improvement in capacity can translate into shipper rate relief.
Conditions are expected to remain more favorable across the South Central region than farther north. Northern and upper Midwest markets typically become more sensitive as temperatures fall, as late-season agricultural freight moves, and carriers begin adjusting their networks for winter operations.
November should bring relatively balanced supply vs. demand overall, but northern markets may see more frequent pockets of tightening as weather becomes a larger factor.
West Coast United States
The West continues to show meaningful differences between the Southwest and Pacific Northwest. Southwest capacity tightened moderately during October, but conditions for refrigerated freight have been considerably less constrained than dry van.
Rates have remained relatively stable rather than following the sharper increases seen in dry van markets, suggesting that refrigerated carriers have been better positioned to absorb recent freight activity.
The Pacific Northwest remains the primary pressure point in the West. Seasonal harvests kept outbound capacity tight throughout October, with rates reaching new highs in successive weeks.
That is expected to continue through November as regional agricultural products move to market and holiday food demand builds toward Thanksgiving. Expect capacity to stay tight until harvest-related freight volumes subside.
Flatbed truckload
The flatbed market is beginning its typical transition to looser capacity as winter approaches, but demand remains elevated compared with recent years. Through November, flatbed pricing is expected to follow seasonal trends, increasing around Thanksgiving through the remainder of the year.
Traditional construction activity is beginning to wind down, while project completions create demand for machinery and materials to be repositioned or staged for 2027 projects.
At the same time, manufacturing and project freight tied to large-scale data centers and energy infrastructure continues to provide a steady source of flatbed demand that is less seasonal than traditional construction.
As discussed in the Energy section of this report, power for data centers requires additional equipment for electricity generation and transmission, transformers and other infrastructure that often travels by flatbed.
Even when a construction schedule is delayed, equipment for these projects is still being produced and moved to staging locations, providing underlying support for flatbed volumes heading into 2027.
Winter conditions are also beginning to change the available carrier pool in certain northern markets. Tarping requirements for metals and other weather-sensitive materials typically increase beginning in November as exposure to snow, moisture, and road salt becomes a greater concern.
At the same time, carriers become more selective about operating in Canada, northern U.S. states, and mountain regions as snow, chain requirements, and difficult loading conditions increase operating complexity.
This can reduce usable flatbed capacity even as construction activity moderates. Long-haul freight into the Pacific Northwest, upper Midwest, Mountain West, and Canada is typically among the first to experience this seasonal shift.
Voice of the carrier
What are asset-based carriers saying about the current freight environment? These observations come from a cross-section of the contract carriers in the C.H. Robinson network—the largest in North America.
Market
- Operating costs continue to outpace rate improvement, with higher fuel, insurance, labor, maintenance, and equipment expenses limiting carrier profitability.
- Carriers are increasingly selective about freight, prioritizing repeatable business and a strong fit with their network footprint over chasing transactional volume.
- Carrier’s confidence in their pricing power is growing as capacity tightens and contracts are renewed.
Drivers
- Recruiting and retention remain major challenges for long-haul fleets. The are using higher pay, referral bonuses, driver schools, and more home time as incentives.
- Driver availability varies significantly by business model, with local and drayage fleets reporting considerably better recruiting conditions than long-haul carriers.
- Carriers are focused on driver quality. Stricter hiring standards and retention are increasingly favored over aggressive headcount growth.
Equipment
- Fleet expansion remains limited. Most carriers are prioritizing higher utilization of existing equipment and replacement of aging vehicles rather than adding net capacity.
- Replacement cycles are lengthening as higher prices for trucks, insurance, financing, maintenance, and parts increase the cost of having a bigger fleet.
- Equipment investment remains targeted, with additions concentrated in drayage, specialized freight, and other opportunities where demand and margins justify growth.

 Umsetzbare Einblicke in den Frachtmarkt